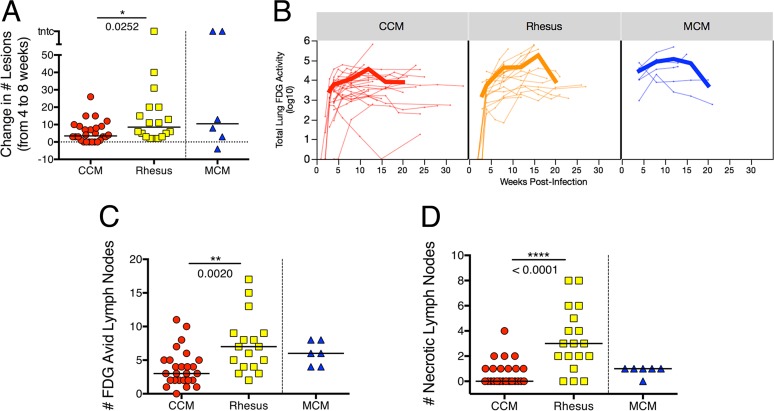
FIG 2.
Comparison of scan outcomes across species. (A) Change in numbers of granulomas from 4 to 8 weeks postinfection, as a measure of dissemination. (B) Total lung inflammation over time as measured by FDG avidity on PET scan. Each thin line represents an individual animal, and the thick lines represent means for species. On average, there is a higher rate of increase in inflammation in rhesus macaques than in Chinese cynomolgus macaques (CCM). The later time points are for fewer animals, and the animals necropsied after 4 months postinfection tend to have less severe disease, which is why the average total FDG avidity decreases. (C) Number of FDG-avid (standard uptake value with muscle ratio [SUVR] > 5) thoracic lymph nodes, as measured by PET-CT immediately prior to necropsy. (D) Number of necrotic lymph nodes observed on PET-CT scan. When a lymph node becomes necrotic, it appears donut-shaped on the scan, where the SUV values are higher around the circumference of the structure. These data are from PET-CT scans immediately prior to necropsy. In panels A, C, and D, each symbol represents the value for one animal, and short lines represent medians of the groups. Mann-Whitney test was used to compare CCM and rhesus macaque groups; Mauritian cynomolgus macaques (MCM) are not included in statistical comparisons.

