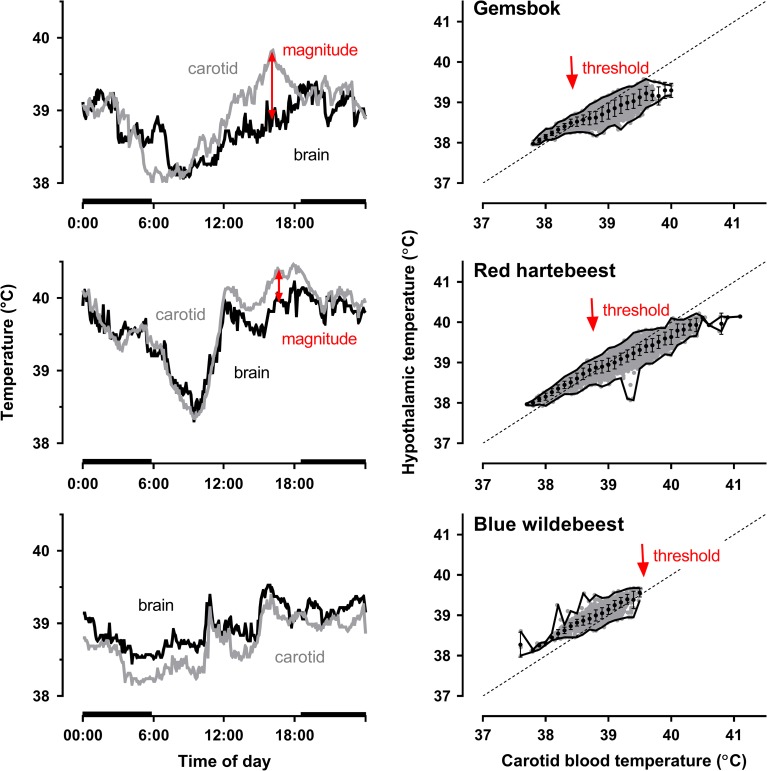
Figure 2:
Left panels show the 24 h carotid blood and hypothalamic temperature profiles of a single gemsbok Oryx gazella (upper), red hartebeest Alcelaphus buselaphus (middle) and blue wildebeest Connochaetes taurinus (lower), for a single day, when the animals were free living in the same conditions in the Northern Cape Province, South Africa. Red arrows represent the magnitude of selective brain cooling within the 24 h period. Horizontal black bars indicate night time. Right panels show the correlation of hypothalamic temperature against carotid arterial blood temperature (grey circles) as well as hypothalamic temperature (mean ± SD) for every 0.1°C bin of simultaneous carotid arterial blood temperature, in the same gemsbok (upper), red hartebeest (middle) and blue wildebeest (lower) over a 5 day period during which they were exposed to the same environmental conditions. The boundary lines demonstrate the minimum and maximum hypothalamic temperatures in each bin. The diagonal line is the line of identity. Red arrows indicate the respective observed threshold temperatures for selective brain cooling; in the blue wildebeest the threshold was not reached within the range of measurement. Data from Strauss et al. (2016).

