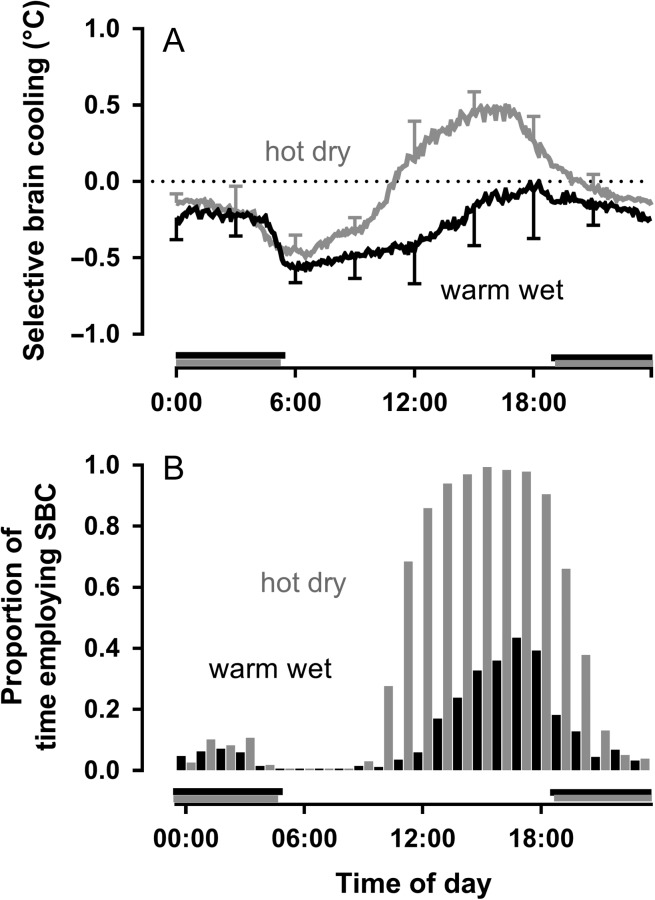
Figure 4:
The effect of aridity on selective brain cooling as illustrated through differences in the mean (±SD) magnitude of selective brain cooling (carotid blood temperature minus hypothalamic temperature; A) and the proportion of time that a single Arabian oryx used selective brain cooling in the hot, hyper-arid deserts of Saudi Arabia (B). Grey depicts the hot dry and black the warm wet periods. Horizontal grey and black bars depict night-time during the two periods of interest. Data from Hetem et al. (2012).

