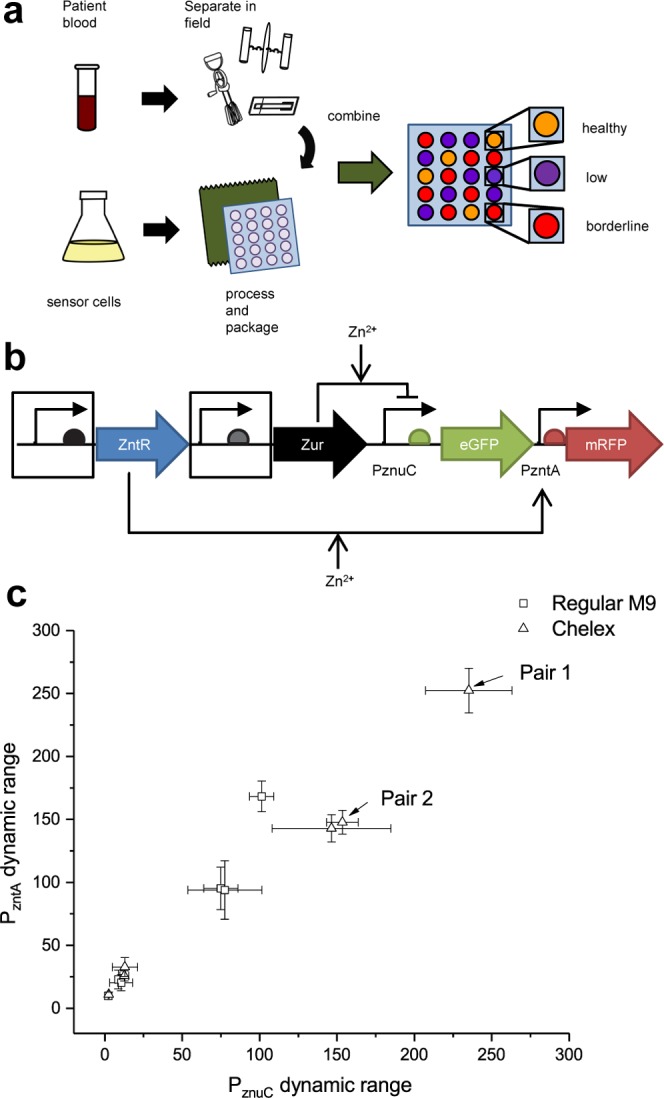
Figure 1.

(a) Schematic of envisioned test implementation. Patient blood is collected in the field, separated using field-friendly approaches, and combined with packaged sensor cells. The cells grow and produce pigment indicative of subject micronutrient status. (b) Schematic of regulator test construct. The promoters and ribosomal binding sites (boxed) for zinc-responsive regulators ZntR and Zur were varied to determine optimal expression for improved dynamic range over physiologically relevant zinc concentrations. (c) Fluorescent reporter output demonstrating sensor dynamic range from 0 to 20 μM Zn2+ with different expression levels for ZntR and Zur. Regulator pairs one and two (arrows) were used in subsequent two- and three-color pigment biosensors. Error bars indicate standard deviation.
