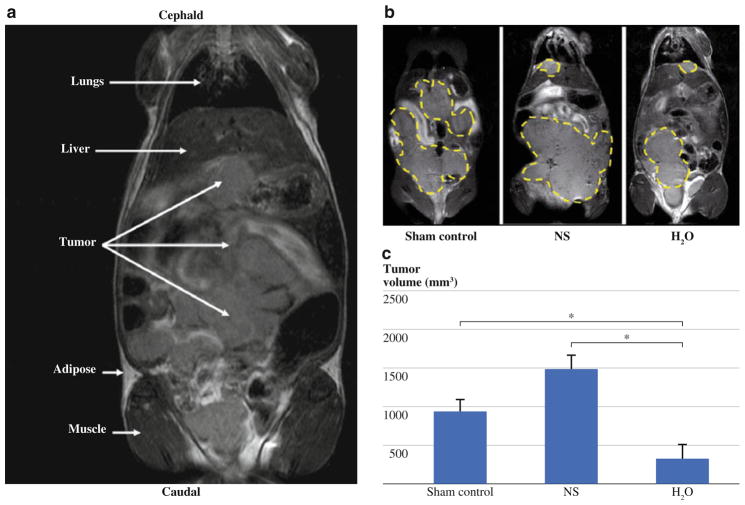
FIG. 4.
a Coronal T2-weighted (T2W) MR image of mouse showing differences in tissue contrast between peritoneal tumor implants and surrounding normal anatomic structures. b Representative T2W MR images of a sham-treated control, saline-treated (NS), and water-treated (H2O) mouse showing extent of tumor burden (outlined in yellow) on day 23 after treatment. c Bar graph shows tumor volumes for animals in all 3 groups (n = 5/group) calculated from T2W MR images. A significant reduction in tumor volume in H2O-treated animals compared to NS- or sham-treated control groups (P <0.05). NS-treated groups are noted to have a larger average tumor volume compared to sham control groups, but statistical significance was not reached

