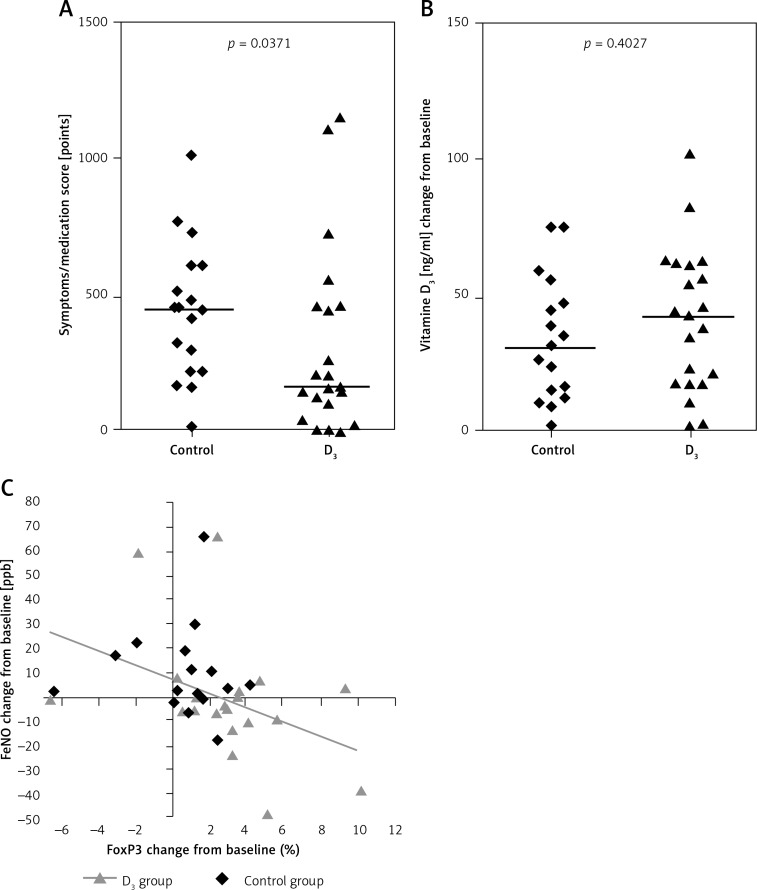
Figure 1.
Changes in clinical parameters in children from the vitamin D group compared to children from the control group; between-group analysis. Relative changes in serum concentration of 25(OH)D between visit #1 and visit #2 in both study groups. The correlation between CD4+CD25+Foxp3+ cell induction and FENO reduction

