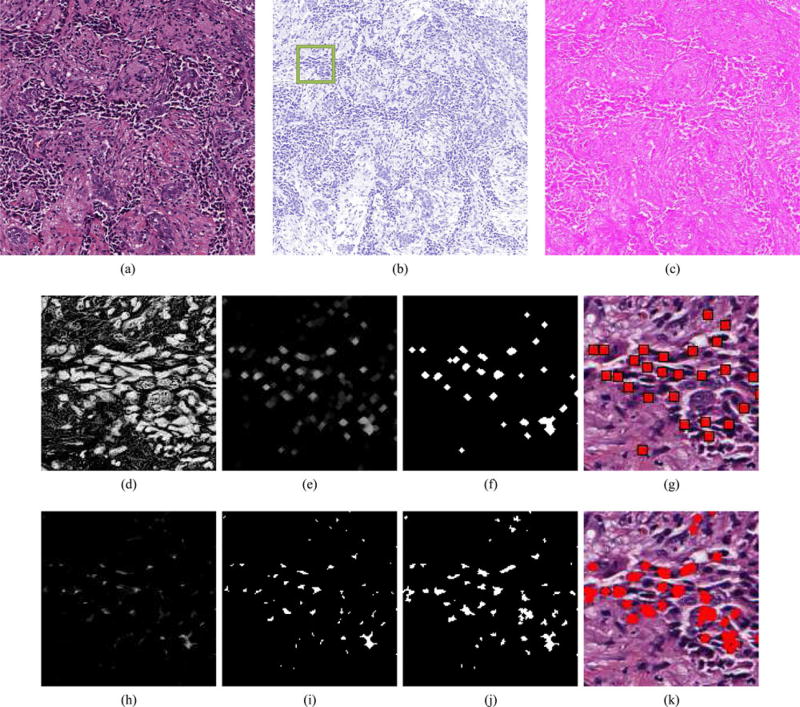
Fig. 4.
(a) High-grade histopathology image with its (b) hematoxylin and (c) eosin channels separated by color deconvolution. The green box in (b) denotes an inset providing more detailed visualization of the nuclear detection and segmentation process in (d)–(k). For nuclear detection, (d) the intensity of the hematoxlyin channel undergoes, (e) morphological opening, and (f) thresholding. (g) Centroids of the individual nuclei are later used for graph construction. The nuclear segmentation process also uses (d) the intensity of the hematoxylin channel, applying (h) morphological erosion, (i) thresholding, and (j) the color gradient based active contour model (CGAC), to achieve (k) a final segmentation result that is used for extraction of nuclear texture.

