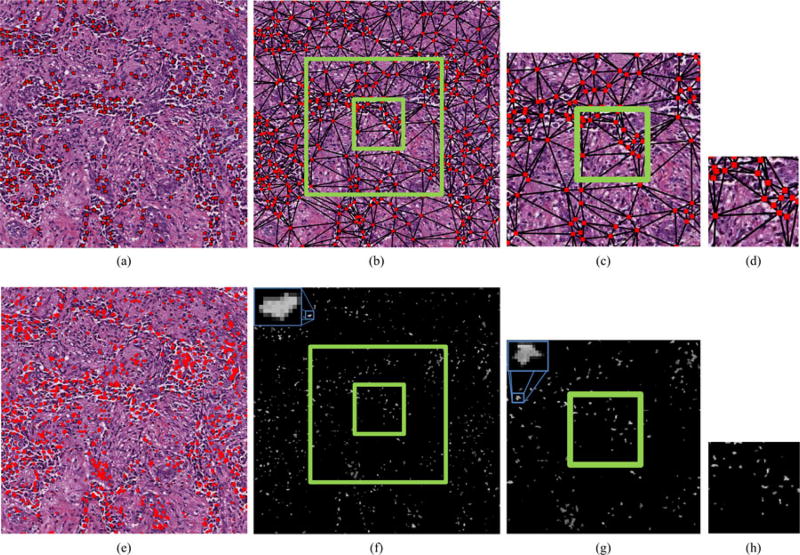
Fig. 5.
(a) Centroids of nuclei are isolated from the hematoxylin channel and used as vertices for the construction of graphs such as the (b)–(d) DT at various FOV sizes, from which features describing nuclear architecture are extracted. (e) The segmentation of nuclei allows for extraction of Haralick texture features such as (f)–(h) Contrast Variance in FOVs of various sizes. For all images, note that green boxes represent FOVs of different sizes and blue boxes represent insets to enhance visualization.

