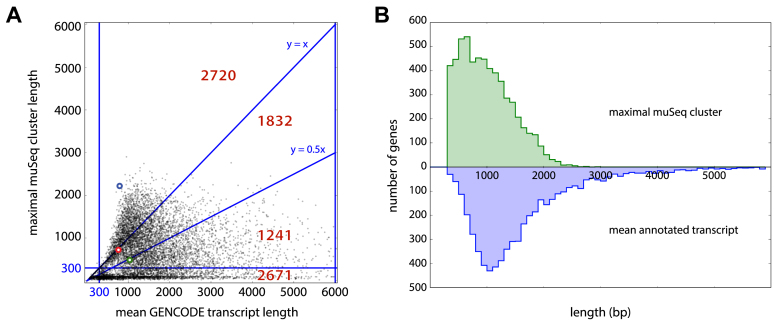
Figure 5.
muSeq cluster length compared to annotated genes. (A) For each gene, we compared its average annotated isoform length (x-axis) with the longest ‘proper and complete’ muSeq cluster covering it (y-axis). The plot is subdivided into regions with red numbers indicate the number of genes in each region. The highlighted blue, green and red circles correspond to the genes ARL6IP1, RPS15A and RP11-1035H13.3, respectively (described in detail in Figure 6). The longest transcript for ARL6IP1 is observed in the muSeq library, and its length far exceeds the average transcript length (blue dot above y = x). We also observe the full length of the only annotated RP11-1035H13.3 transcript in the muSeq library (red dot on line y = x). Whereas we observe many full-length muSeq transcripts of RPS15A, the GENCODE database includes many long, unspliced isoforms that are not present in the muSeq library (green dot on line y = 0.5x). (B) A histogram of the maximal muSeq cluster length per gene is shown in green, and the average length over all GENCODE-annotated transcripts of that gene in blue. The distributions are well-matched, with a slight shift and heavier tail to the annotated transcripts.

