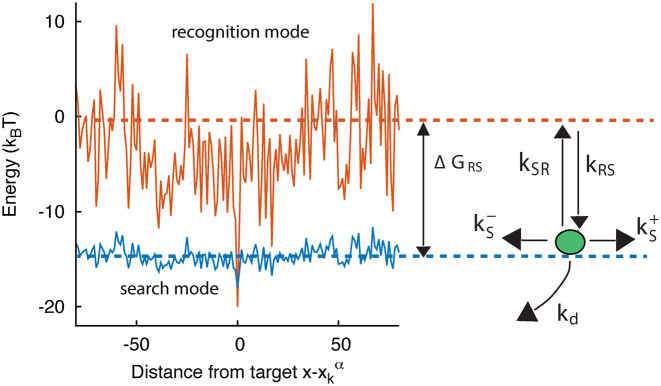
Figure 1.
Graphical representation of the two-state model. The two continuous curves represent the energy levels of the two modes of a TF, equal to Eα(x) (recognition mode, top curve) and  (search mode, bottom curve). The dashed lines denote the average energy in the two modes. The arrows represent the transitions in the stochastic model, characterized by the rates in Equation (3).

