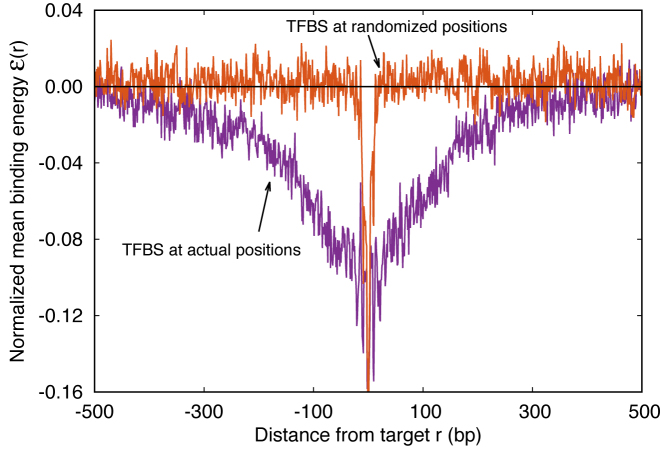
Figure 2.
Average normalized binding energy  (4) as a function of the distance r from the target. The curve labeled TFBS at actual position displays
  computed over the whole set of 1544 unique target sequences in the DB (see ‘Materials and Methods’ section). The other curve represents the
  computed with TFBS at randomized positions (as labeled) on the DNA. The randomized coordinates are drawn with uniform probability on the DNA, with the only constraint of being at least 1000 bp away from any other target sequence in the DB.

