Figure 4.
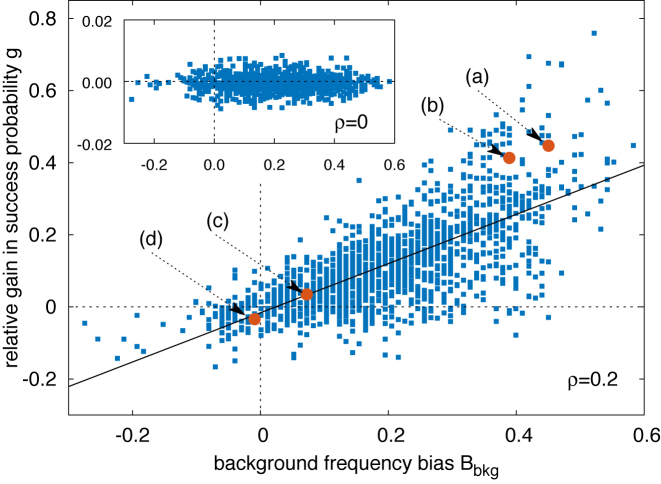
Scatter plot of the relative success-probability gain g(α, k) [Equation (7)] to find the target versus the background frequency bias Bbkg(α, k) [Equation (6)]. The success probabilities for each TFBS and its randomized counterparts have been estimated by averaging over 106 realizations of the stochastic model, with the TF initialized as described in ‘Materials and Methods’ section. ρ = 0.2 and the other parameters are fixed as in ‘Materials and Methods’ section. The black solid line is the result of a linear regression giving g = 0.68 Bbkg − 0.016 with Pearson correlation coefficient r = 0.72. Filled circles labeled as (a–d) correspond to the specific sequences analyzed in Figure 6: (a) TATTGCTCCACTGTTTA for PhoP; (b) GTAAAAATATATAAA for CpxR; (c) AAGCAAAGCGCAG for Ada; (d) TGCGTGAAAAACTGTC for PhoB. Inset: same scatter plot as in the main figure but with ρ = 0, i.e. without specificity in the S state. In this case, no gain in success probability is observed (notice the scale on the y axis).

