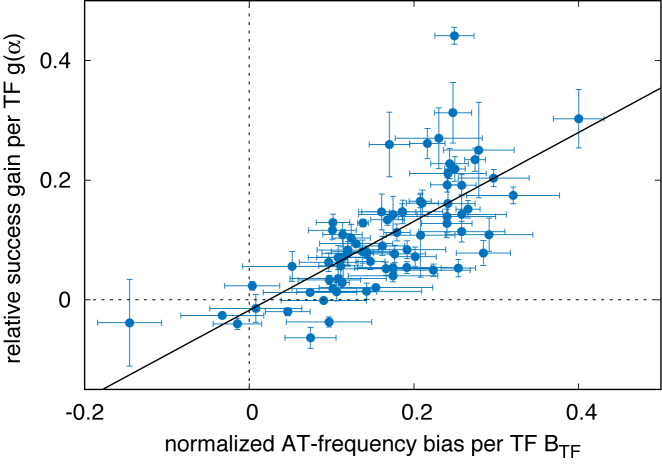
Figure 5.
Classification of TFs according to their AT frequency bias and target finding success. Relative gain in probability of success per TF (averaged over their target sequences), g(α), as a function of the AT relative frequency bias per TF, BTF(α), see Equation (8). The error bars represent the standard error over the sample of Mα TFBS of TF α. The line is the linear regression g = 0.74BTF − 0.018 with Pearson correlation coefficient r ≈ 0.71.

