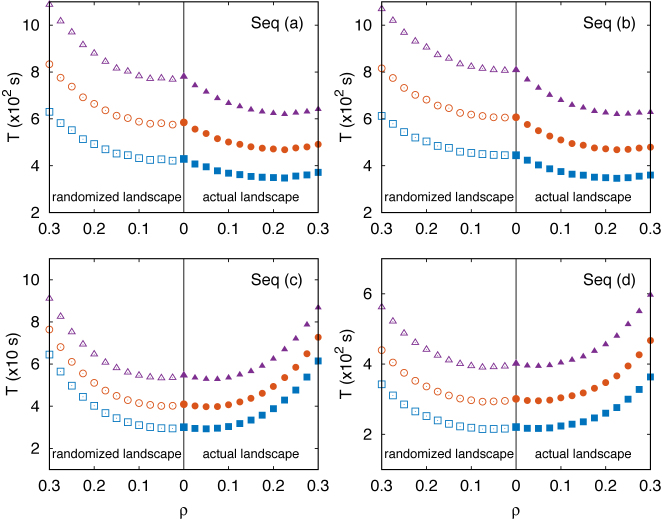
Figure 6.
Total search time T, computed as in Equation (10), versus ρ for four target sequences of four different TFs as labeled in Figure 4. In each panel, the three curves correspond to different assumptions for the average duration of a 3D diffusion round t3D = νt1D(ρ = 0): (boxes) ν = 0.1, (circles) ν = 0.5 (triangles) ν = 1. Filled symbols (on the right of the vertical solid line) refer to computation of the success probability Ps(α, k) performed with the target sequences at their actual positions. Empty symbols on the left correspond to the computation performed by randomizing the positions of the TFBSs. Each symbol is obtained by an average over 106 realizations. The average sliding time t1D is estimated by simulating 106 sliding events at random locations far from the target sequence.

