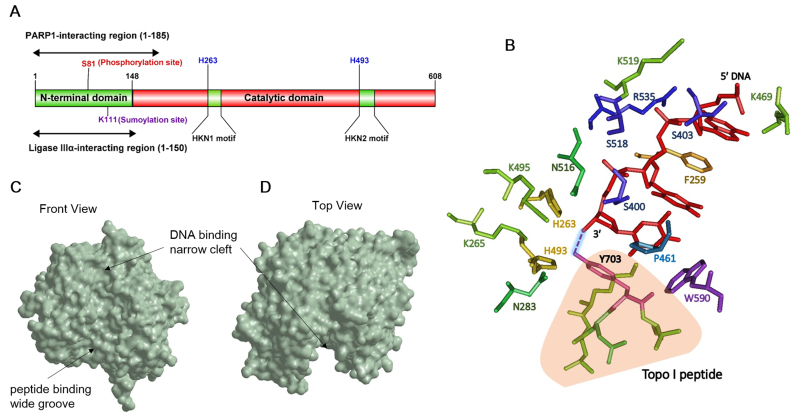
Figure 1.
Structure of TDP1. (A) Domain structure of human TDP1. Sites shown in blue are key residues in the active site of TDP1. (B) Critical TDP1-substrate interactions in the TDP1 active site. Crystal structure of TDP1 (1NOP) obtained from Protein Data Bank (PDB) website was used to generate a model of the TDP1 active site in complex with the DNA substrate and the Top I peptide using Cn3D. Amino acids in the active site are represented as sticks and color-coded. DNA substrate is shown in red. 3′-phosphotyrosyl bond is indicated as a dashed line between 3′ end of the substrate and Y703 and highlighted. Top I peptide is shown in light orange. (C and D) Surface representation of TDP1 substrate binding channel was generated using Chem3D on crystal structure of TDP1 (1JY1) obtained from PDB (C) Front view and (D) Top view of the substrate binding channel with the DNA and peptide binding regions highlighted.

