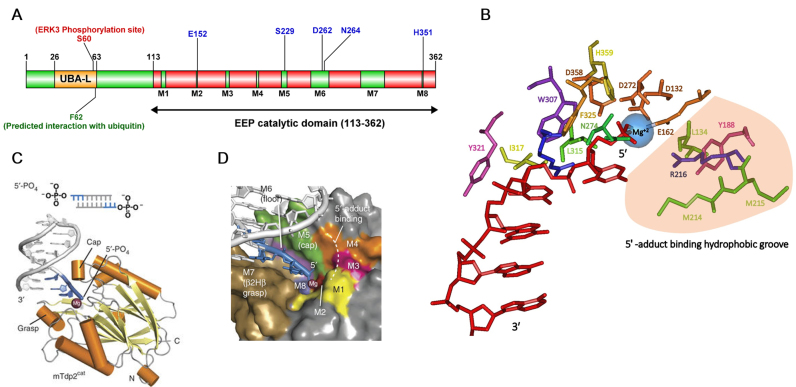
Figure 4.
Structure of TDP2. (A) Domain structure of TDP2. Sites shown in blue are key residues in the active site of TDP2. (B) Critical TDP2-substrate-Mg+2 interactions in the TDP2 active site. Crystal structure of TDP2 (4GZ1) obtained from PDB was used to generate a model of the TDP2 active site in complex with the DNA substrate and the Mg+2 ion using Cn3D. Amino acids in the active site are represented as sticks and color-coded. DNA substrate is shown in red with the indicated 5′ and 3′ ends. Mg+2 is shown as a blue sphere. 5′-tyrosyl binding region lined by hydrophobic residues is shown in light orange. (C) Structure of mTDP2cat in complex with Mg2+ and 5′-phosphate DNA [Image reproduced with permission from (103)]. (D) Interaction of 5′-phosphate DNA end shown in blue with the color-coded active site motifs is shown. [Image reproduced with permission from (103)].

