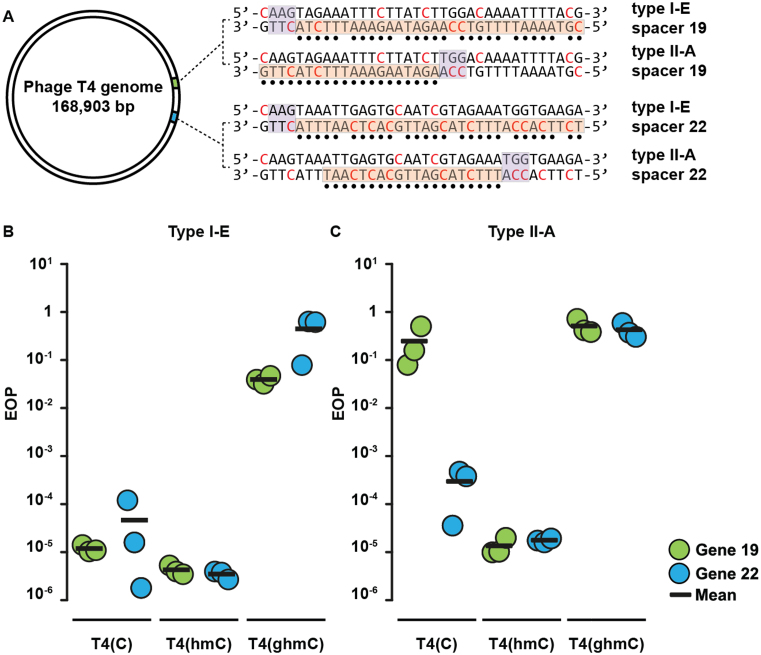
Figure 2.
Efficiency of plaquing (EOP) assays of T4 phages on E. coli cells expressing CRISPR–Cas systems targeting T4 genes 19 or 22. (A) Representation of the circular genome of bacteriophage T4. Positions of protospacer sequences and PAMs are shown (indicated by orange bars and purple bars respectively). Glucosyl-5-hydroxymethylcytosines are indicated in red and nucleotides that base pair with crRNA are indicated by black dots. (B) EOP of T4 phages on E. coli cells expressing targeting Cascade complexes normalized to EOP on non-targeting strains. (C) EOP of T4 phages on E. coli cells expressing targeting Cas9 proteins normalized to EOP on non-targeting strains.

