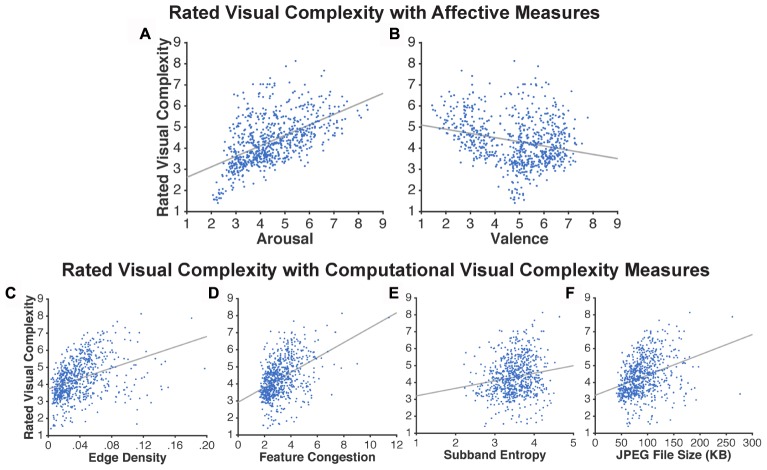
FIGURE 3.
Scatter plots based on the ratings obtained in Experiment 1. Relationship between visual complexity and affect ratings: (A) arousal and (B) valence. Relationship between visual complexity ratings and computational measures: (C) edge density, (D) feature congestion, (E) subband entropy, and (F) JPEG file size. Each dot represents an individual picture (720 in total); lines represent linear regressions.

