Figure 1.

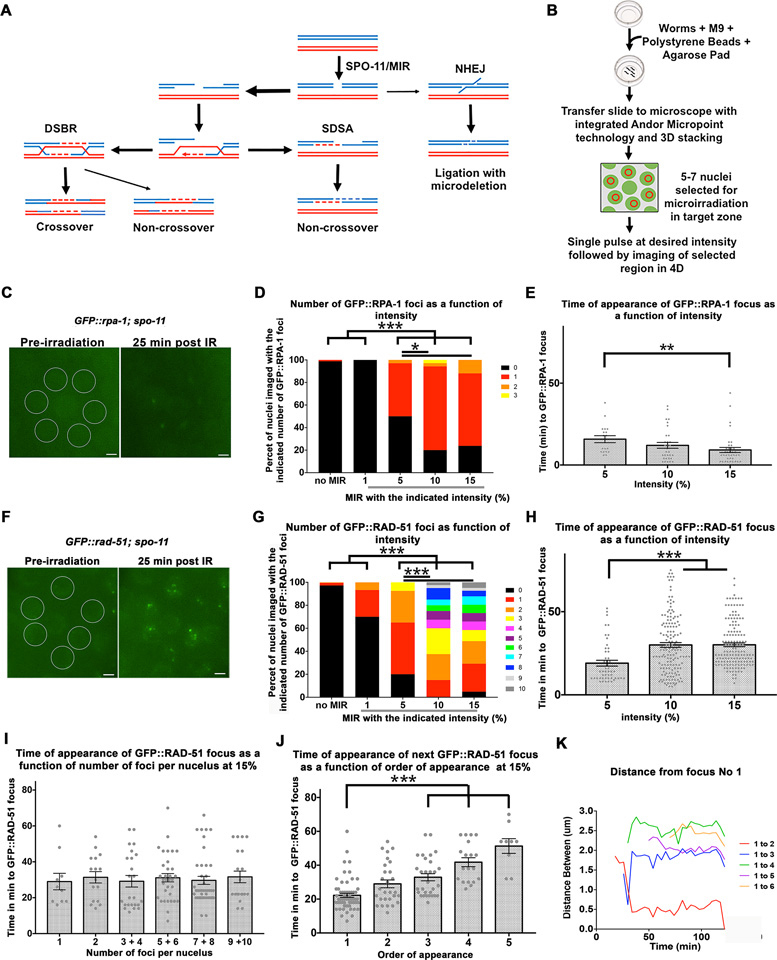
Laser microirradiation of C. elegans germline nuclei leads to GFP::RPA-1 and GFP::RAD-51 foci appearance. (A) Schematic representation of pathways for the repair of DSBs; meiotic DSBs are induced by SPO-11 (wild type cells) or MIR (in this manuscript) and then repaired by the double stand break repair pathway (DSB) or synthesis dependent strand annealing pathway (SDSA). Non homologous end joining can also repair DSBs, but it not a favored pathway in meiosis. (B) Schematic representation of microirradiation experimental design. (C) An example of nuclei selected for microirradiation prior to microirradiation (left image) and the same nuclei with visible GFP::RPA-1 foci 25 min post-microirradiation (right image). Scale bar, 2 μm. (D) Different laser pulse intensities (1–15%) were applied to MP nuclei and the number of GFP::RPA-1 foci per nucleus was counted for each intensity setting. n nuclei for 0 = 171, 1% = 30, 5% = 34, 10% = 35, 15% = 42. (E) The same foci from the experiment described in D were also quantified according to the time (in minutes) it took them to appear for each level of intensity. 1% intensity was intentionally left out given that this intensity did not produce any foci. Each data point represents a focus generated. n foci for 5% = 18, 10% = 31, 15% = 37. (F) An example of nuclei selected for microirradiation prior to microirradiation (left image) and the same nuclei with visible GFP::RAD-51 foci 25 min post-microirradiation (right image). Scale bar, 2 μm. (G) Different pulse intensities (1–15%) were applied to mid-pachytene nuclei and the number of GFP::RAD-51 foci per nucleus was counted for each intensity. n nuclei for 0 = 220, 1% = 30, 5% = 40, 10% = 40, 15% = 41. (H) The same foci from the experiment described in G were also quantified according to time of appearance (in minutes) for 5, 10, and 15%. 1% not included given that this intensity only produced foci in 2 nuclei. Each data point represents a focus generated. n foci for 5% = 49, 10% = 152, 15% = 149. (I) Time of appearance of foci in nuclei with a particular number of foci. Each data point represents a nucleus with a focus (or foci). n foci for nucleus with one focus = 10, two foci = 16, 3 and 4 foci = 24, 5 and 6 foci = 33, 7 and 8 foci = 37, 9 and 10 foci = 29. All values are insignificant from each other (Kruskal-Wallis test P = 0.42). (J) Time of appearance of the subsequent foci plotted as a function of the order of their appearance. Each data point represents a focus generated. n foci first focus = 62, second focus = 30, third focus = 28, fourth focus = 19, fifth focus = 9. For simplicity of representation p values only for the first focus comparisons are represented. (K) Movement of foci within one particular MP nucleus was quantified by measuring the distance (in μm) between each focus and the focus designated focus number one. Each data point indicates a measurement taken at that time point for the specific pairwise distance indicated by the graph legend. Data point in purple shows example of coalescing foci with focus #1. Bars in all graphs represent the mean ± SEM. * is for 0.01 < P < 0.05, ** is for 0.0001 < P < 0.01, *** is for P < 0.0001. For exact P-values, mean, SD and SEM values see Tables S1–S5 in Supplementary Material.
