Figure 3.

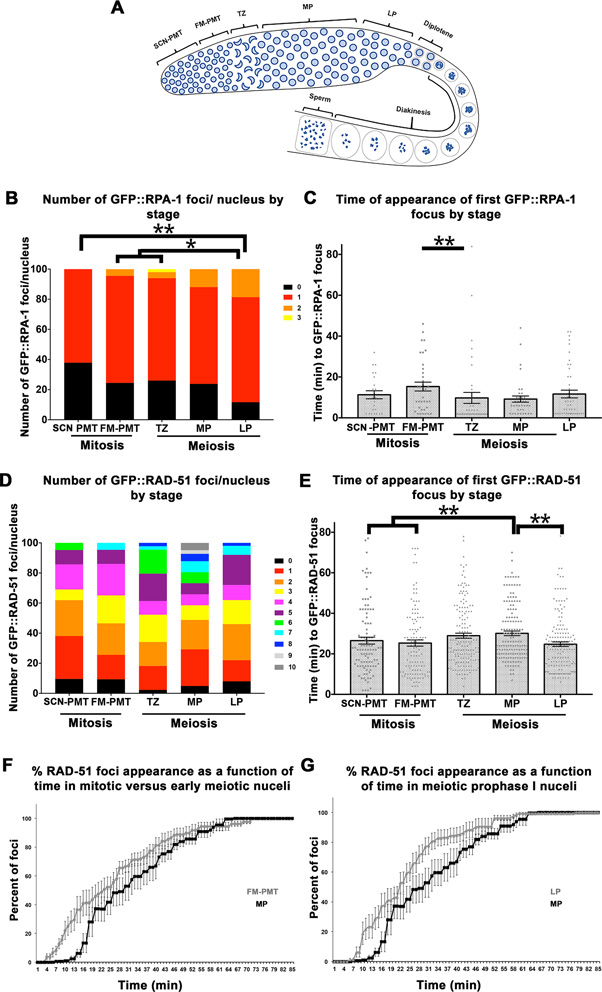
Differences in number and time of appearance of GFP::RPA-1 and GFP::RAD-51 foci between mitotic and meiotic cells. (A) Cartoon representation of the stages of meiosis in the C. elegans germline. Nuclei in mitosis (FM-PMT [row 5], SCN-PMT[rows 9–11]) and meiosis (TZ, MP, LP) were microirradiated and compared in terms of number of foci per nucleus (B) and time of appearance (C) in the GFP::RPA-1, spo-11. (B) n nuclei SCN-PMT = 34, FM-PMT = 45, TZ = 50, MP = 42, LP = 43. (C) Each data point in (C) represents a focus, when bars are the mean ± SEM. Only P < 0.01 are shown. n foci SCN-PMT = 23, FM-PMT = 36, TZ = 41, MP = 37, LP = 46.The same experiment described in B and C was applied to the GFP::RAD-51, spo-11. (D) n nuclei SCN-PMT = 42, FM-PMT = 43, TZ = 44, MP = 41, LP = 50. (E) Each data point in (E) represents a focus, when bars are the mean ± SEM. Only P < 0.01 are shown. n foci SCN-PMT = 100, FM-PMT = 118, TZ = 158, MP = 149, LP = 155. (F and G) The percent of GFP::RAD-51 foci appearance was plotted as a function of time for mitotic (FM-PMT) versus MP nuclei (F) and for meiotic prophase I nuclei MP and LP (G). Meiotic prophase I MP and LP. Mean of % foci at each time point in each gonad ± SEM. * is for 0.01 < P < 0.05, ** is for 0.0001 < P < 0.01. For exact P-values, mean, SD and SEM values see Supplementary Tables S8–S10 in Supplementary figures.
