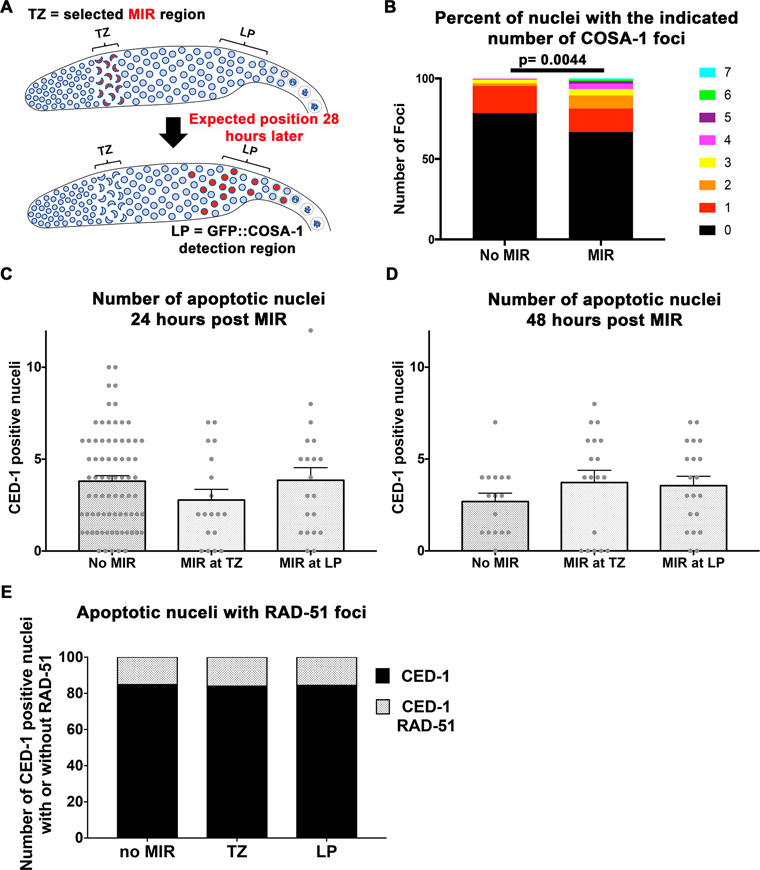
Figure 4.

The effect of microirradiation on crossover formation and apoptosis. (A) Cartoon representation of the design of the GFP::COSA-1 experiment. (B) COSA-1 foci numbers with and without irradiation n = 130, 125 respectively. (C) The number of CED-1 positive cells a function of microirradiation in TZ or LP 24 h post treatment. No significant values are observed. n gonads no MIR = 76, TZ MIR = 18, LP MIR = 20. (D) same as (A), but at 48 h treatment. No significant values are observed. n gonads no MIR = 16, TZ MIR = 18, LP MIR = 20. (E) Fraction of RAD-51 positive nuclei among nuclei with CED-1. No significant values are observed. n gonads no MIR = 284, TZ MIR = 50, LP MIR = 77.
