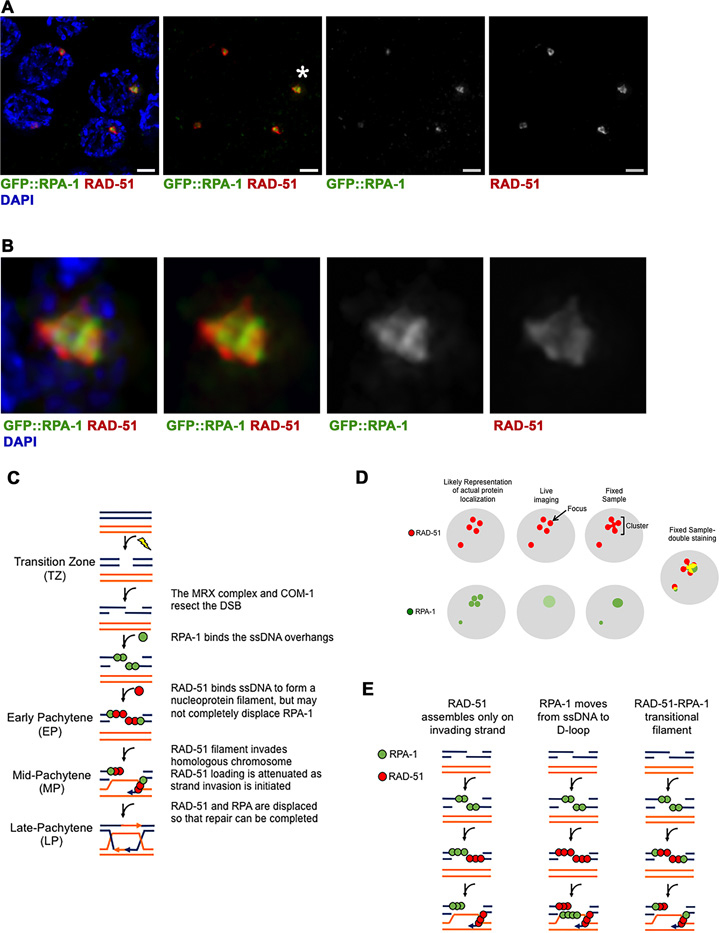
Figure 5.

RPA-1 and RAD-51 colocalize on laser microirradiation DSBs. (A) GFP::RPA-1 strain was microirradiated and stained with both anti-GFP(green), anti-RAD-51(red) antibody and DAPI (blue) to visualize chromosomes. Four representative MP nuclei are shown. Three of the nuclei show colocalization between RPA-1 and RAD-51. The fourth nucleus (bottom left) shows RAD-51 cluster with very faint RPA-1 (defined as ‘mostly RAD-51’ in Table 3). Scale bar 2 μm. (B) Zoomed in images of the foci indicated by the asterisks in A. (C) Model depicting the process of DSB repair as it occurs in the different stages of the C. elegans germline. The model is canonical until Early Pachytene, where RAD-51 may not completely displace RPA-1 on the ssDNA overhang. RAD-51 may also be attenuated in Mid-Pachytene by the initiation of strand invasion. (D) Model depicting how individual RAD-51 and RPA-1 foci may appear as clusters upon fixed sample staining, with comparison to how similar foci appear in live imaging. The live imaging representation for RPA-1 is a lighter green, meant to demonstrate the weak signal of the GFP::RPA-1 strain. (E) Model depicting the three most likely explanations for the appearance of a mixed RPA-RAD-51 filament. The first two columns illustrate the possibility of RPA-1 and RAD-51 occupying different strands around the DSB at the same time, while the third column depicts how a mixed filament may look. RPA-1 is depicted in green, RAD-51 in red, for all sections.
