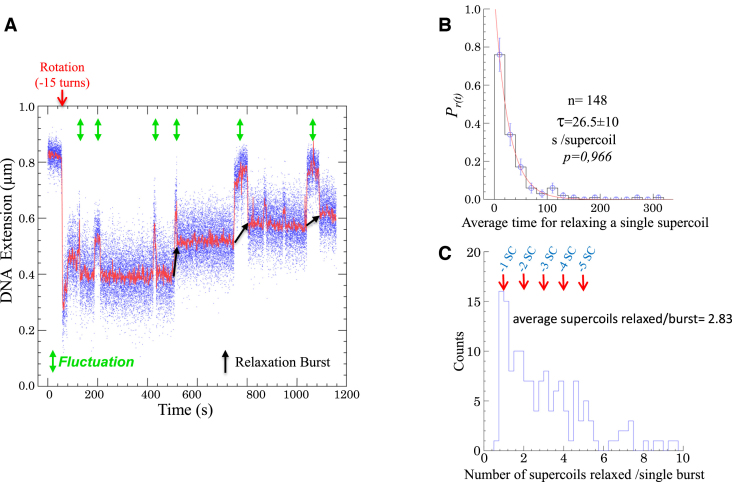
Figure 6.
Relaxation activity of SsoTopA on single molecule. (A) Time-trace of a DNA extension variation at 45°C of a 3 kb DNA extended by a force of 0.45 pN in the presence of 600 pM of SsoTopA. The time at which the negative supercoils are added to the DNA by rotating the magnet, is indicated by a red arrow. Extension length fluctuations are indicated by green arrows and the relaxation burst by black arrows. (B) Histograms of the average time in second per supercoil removed. The red line is the best fit (P-value = 0.966) using the single exponential equation  , where
  is the average time. A total of 148 relaxation events were used in this analysis. (C) Histograms of the burst processivity of SsoTopA. The number of supercoils removed was obtained from the extension variation using, for each bead, its calibration curve (39). The periodicity of one for the supercoil removal is indicated above the peaks. A total of 148 relaxation events were used in this analysis.

