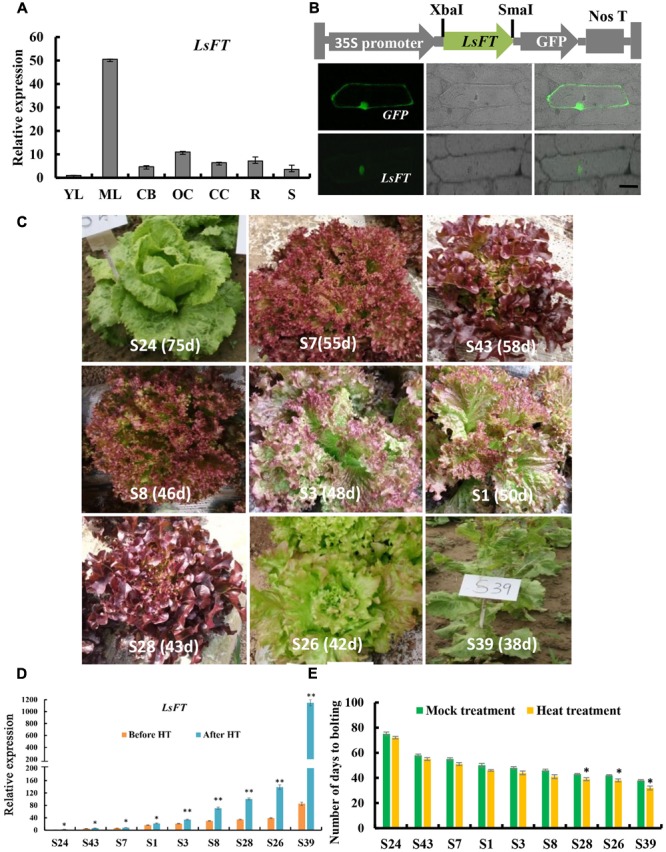
FIGURE 2.

Expression analysis and subcellular localization of LsFT in lettuce. (A) Quantitative real time RT-PCR (qRT-PCR) analysis of LsFT in different tissues of lettuce. YL, young leaves; ML, mature leaves; CB, capitulum buds; OC, opening capitulum; CC, closing capitulum; R, root; S, stem. Lettuce 18S ribosomal RNA (HM047292.1) was used as an internal reference to normalize the expression data. (B) The top row is the diagram of the fusion protein construct used for subcellular localization. The open reading frame (ORF) of LsFT cDNA was introduced into PUC-19 vector using the XbaI and SmaI sites, and fused with GFP in frame. The 35S promoter directs the expression of fusion genes. The bottom row is the subcellular localization of LsFT fusion protein in onion epidermal cells. Plasmid with green fluorescent protein (GFP) alone served as the control (top). Scale bar represents 50 μm. (C) The morphology of lettuce varieties with different bolting times. The days to bolting in the growth chamber were as follows: S24 (75 days), S43 (58 days), S7 (55 days), S1 (50 days), S3 (48 days), S8 (46 days), S28 (43 days), S26 (42 days), S39 (38 days). (D) qRT-PCR analysis of LsFT in different lettuce varieties before and after heat treatment (35°C/25°C) for 48 h. (E) The number of days to bolting under heat treatment (35°C/25°C) and mock treatment. Error bars represent standard errors. Significant difference were determined by student’s t-test (∗represents P < 0.05 and ∗∗indicates P < 0.01).
