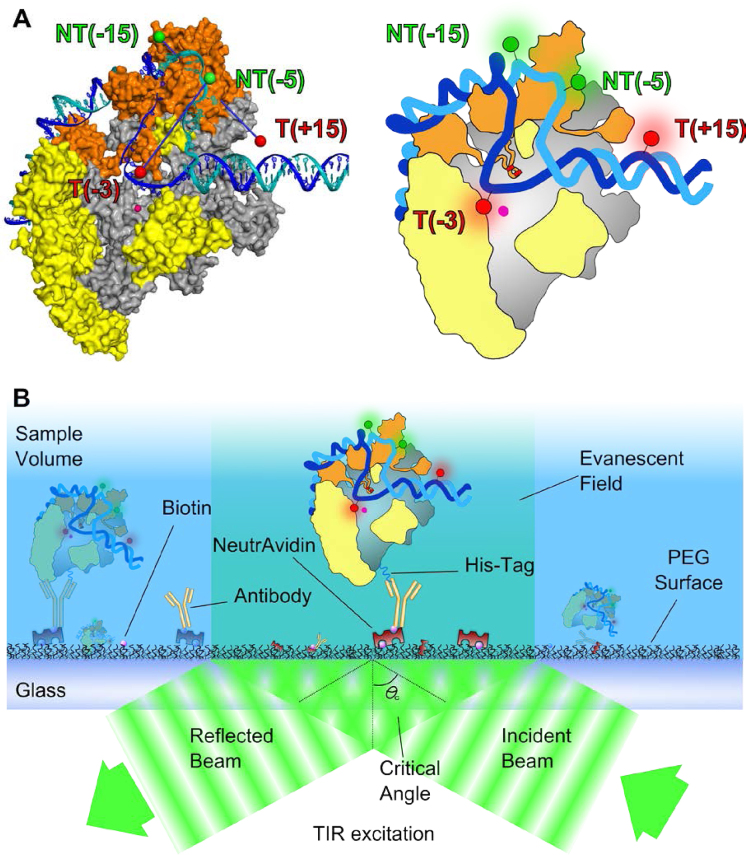
Figure 1.
Schematic of experimental strategy used to monitor the transcription bubble conformation. (A) Fluorophore positions on a cut-away structural model of Escherichia coli RPO obtained using accessible volume modelling (see ‘Materials and Methods’ section). σ70 is shown in orange and core protein is shown in grey except for the regions that protrude in front of the cut-away plane, which are yellow. The β subunit is omitted for clarity. The template strand is shown in blue, the non-template strand in teal. The active site Mg2+ ion is shown as a pink sphere. (B) Schematic of experimental immobilization approach. RPO is immobilized on a PEG-coated surface via anti-His5/His6-tag interactions.

