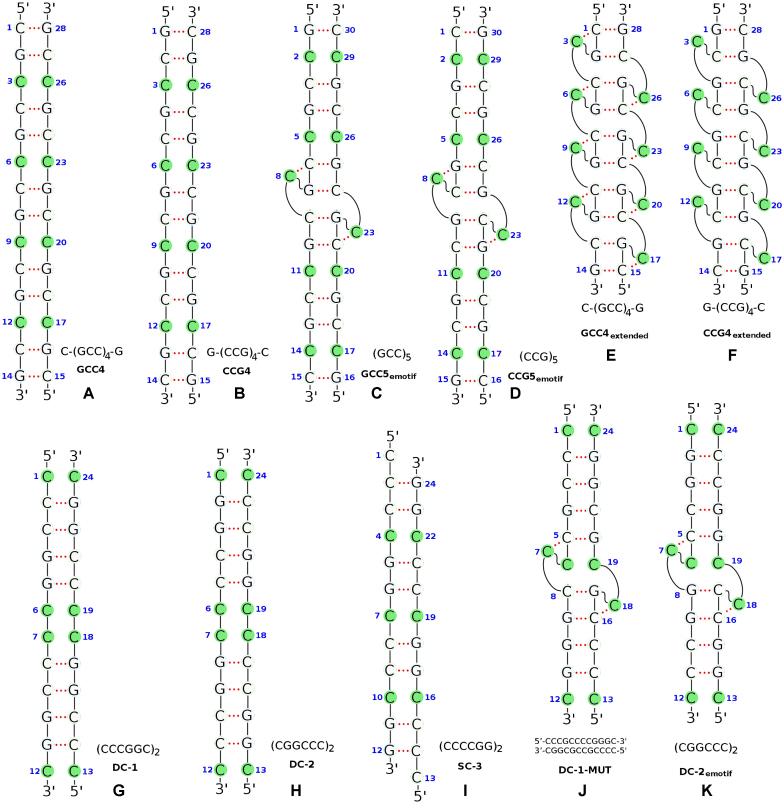
Figure 1.
Schematics of the initial DNA helical duplexes considered in this study. The C mismatched bases are marked by solid green circles. Nucleotide indexes are labeled by blue numbers. Hydrogen bonds are indicated by dashed red lines. More details about the duplexes and the corresponding simulation results are provided in Table 1.

