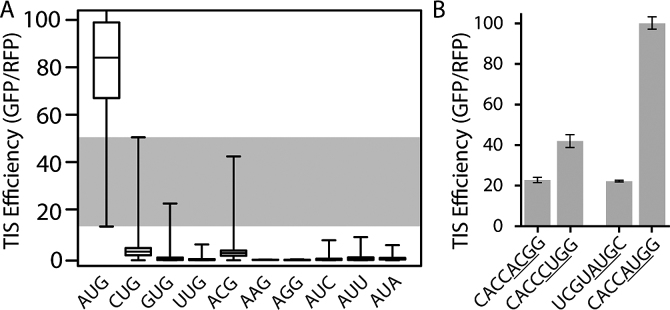
Figure 2.
A subset of non-AUG codons can be as efficient as AUG start codons. A) Box and whisker plot of TIS efficiencies for each start codon. The edges of the box represent the inner quartile range, the bar within the box represents the median, and the bars extending out of the rectangle extend to the maximum and minimum of the range of efficiencies for each codon. The shaded area represents the range of TIS efficiencies where AUG and non-AUG codons overlap. B) TIS efficiencies determined from individually deployed TIS reporter constructs via flow cytometry. Start codons are underlined. Error bars represent the standard deviation between experimental replicates (N = 3).

