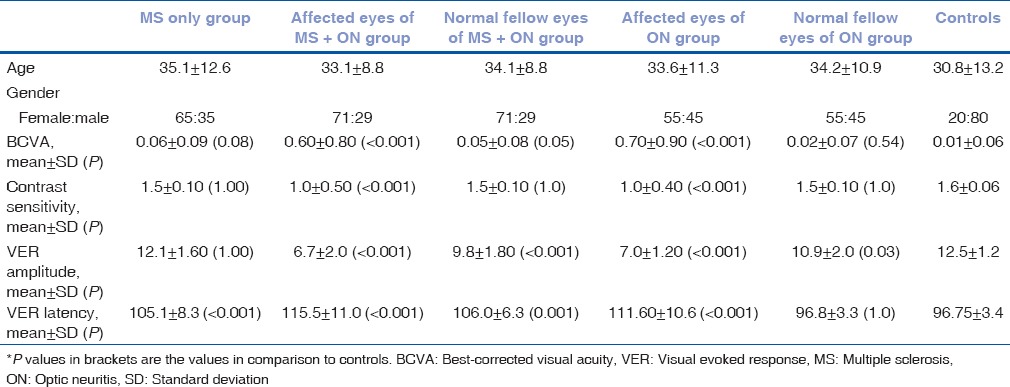
Table 1.
Demographic details and baseline values of best-corrected visual acuity, contrast sensitivity, visual evoked response amplitude, and visual evoked response latency in different groups

Demographic details and baseline values of best-corrected visual acuity, contrast sensitivity, visual evoked response amplitude, and visual evoked response latency in different groups
