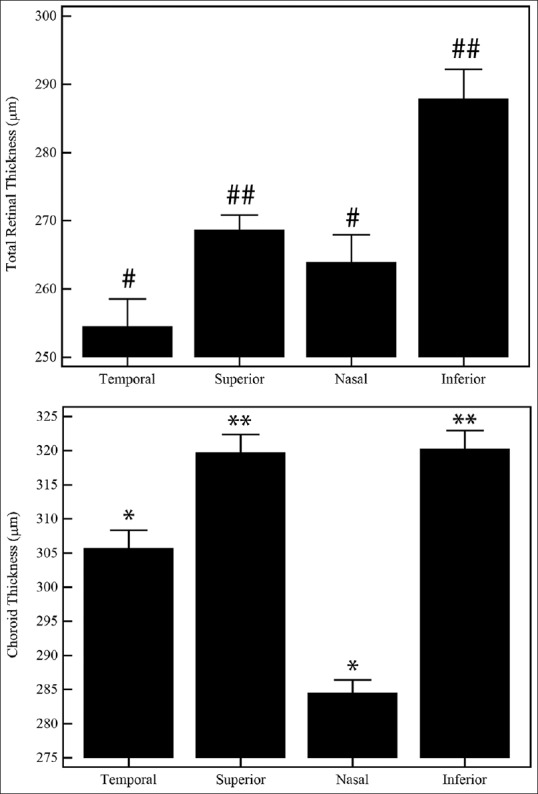
Figure 2.

Regional variations in the total retinal and choroidal thickness within the same eye. Estimated mean ± standard error of the means was plotted. Symbols above the bar plots indicate statistical significance as mentioned in the text. P < 0.05 was considered statistically significant
