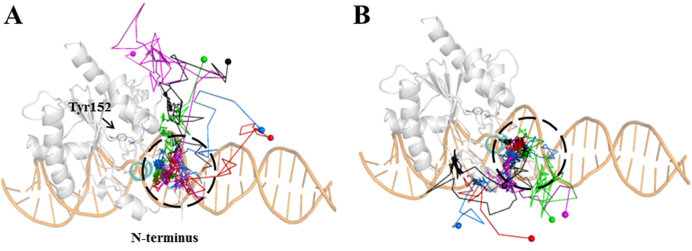
Figure 4.
Direct observations of the thymine release from the S3 state to the solvents from multiple 100-ns MD simulations. According to the releasing direction, two groups of release pathways are shown (A and B). For each group, five representative MD trajectories are demonstrated using different colors (blue, red, green, black and purple), in which the starting conformations of the MD trajectories are highlighted within dashed black circles, and the last MD snapshots (released states) are represented with spheres.

