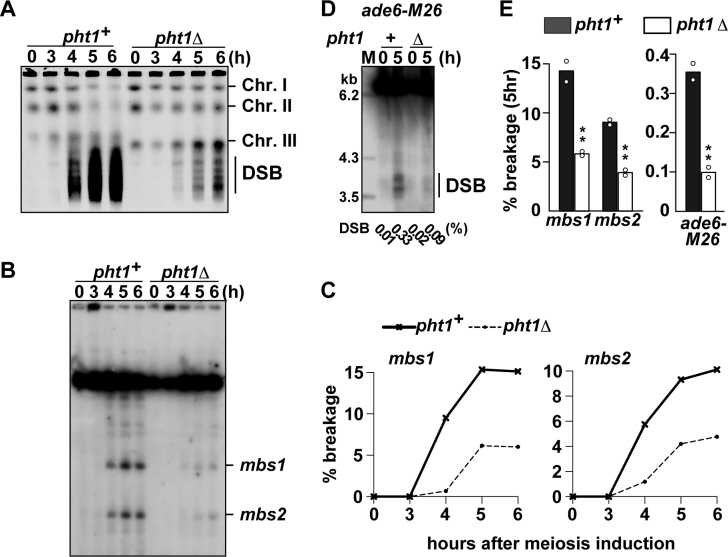
Figure 1.
Effects of pht1 deletion on meiotic DSB formation. pat1–114 rad50S cells were induced into meiosis and were collected at indicated times after the induction. Genomic DNA was analyzed by pulse-field gel electrophoresis (A–C) or standard gel electrophoresis (D). (A) Formation of meiotic DSBs at the chromosome level. DNA was visualized with ethidium bromide. The positions of chromosomes I, II, III and smears resulting from meiotic DSBs are shown. (B) An example showing the meiotic DSBs formed at mbs1 and mbs2. DNA digested with Not I restriction endonuclease was analyzed by Southern blotting with the c227 probe recognizing the left end of the Not I J fragment. (C) Quantification of the DSBs at mbs1 and mbs2 shown in (B). These values were obtained by dividing the signal intensity of broken DNA fragments over the signal intensity of the unbroken Not I J fragment. (D) An example showing the meiotic DSBs formed at ade6-M26. DNA digested with Afl II restriction endonuclease was analyzed by Southern blotting as described in (41). Break frequencies obtained by quantification of the DSBs are indicated underneath the lanes. (E) Summary of DSB frequency quantification at hotspots shown in (B) and (D). Bar graphs are created based on mean breakage frequencies at 5 h after induction of two independent experiments (shown by open circles).

