Figure 3.
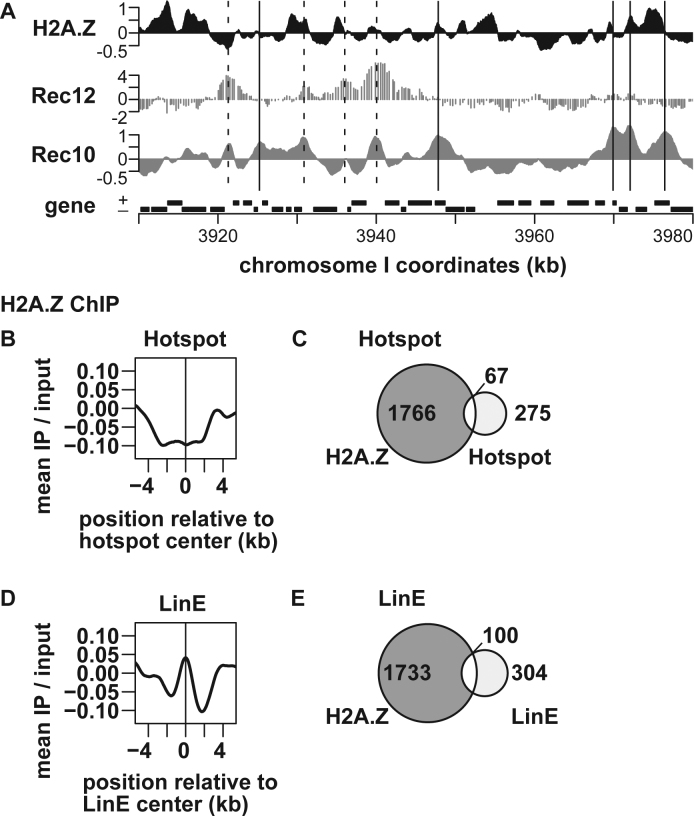
Genome-wide analysis of H2A.Z levels around recombination hotspots and LinE sites. pat1–114 cells were induced into meiosis and harvested at 4 h after meiosis induction. ChIP was performed using an anti-histone H2A.Z anitibody, and the resultant DNA was analyzed by genome tiling arrays. (A) An example of ChIP–chip data. The X-axis shows the chromosomal coordinates in kb and the Y-axis shows the log2 of signal strength. Locations of Rec12–DNA linkage sites (52) and Rec10-binding sites (8) are also shown for comparison. The vertical dotted and solid lines indicate hotspots and LinE sites, respectively. Genes are shown as filled boxes at the bottom of the figure. (B and D) Average distributions of H2A.Z around meiotic recombination hotspots (B) and LinE sites out of hotspots (D). The charts were created by a moving average method with a window size of 1 kb and a step size of 0.1 kb. The Y-axis shows the log2 of signal strength. (C and E) Venn diagrams showing the overlap between H2A.Z and hotspots (C), and between H2A.Z and LinE sites out of hotspots (E).

