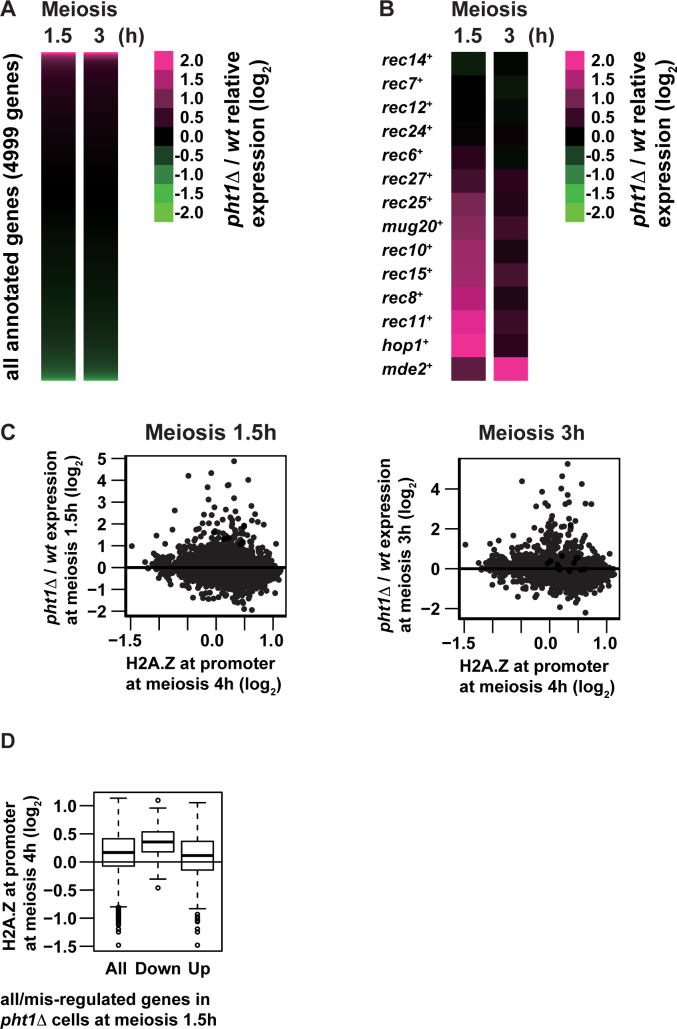
Figure 4.
Transcriptome analyses of pht1+ cells and pht1Δ mutants. h+/h− diploid cells were induced into meiosis and harvested at 1.5 or 3 h after meiosis induction. mRNA was purified from meiotic pht1+ and pht1Δ cells and analyzed with microarray. (A and B) Heat maps of pht1Δ/pht1+ expression ratio (log2) for all annotated genes (4999 genes, A) and genes coding for DSB proteins and LinE components (B). Each row and column represent a gene, and hours after meiosis induction, respectively. The color scale shown on the right illustrates the log2 ratio of pht1Δ to pht1+ expression levels. Magenta and green colors represent high and low relative expression levels respectively. (C) Scatter plot of all annotated genes comparing H2A.Z levels at promoters (log2, X-axis) and pht1Δ/pht1+ expression ratio at 1.5 (left) and 3 (right) h after meiosis induction (log2Y-axis). H2A.Z levels at promoters were calculated by averaging H2A.Z ChIP–chip signals for 4 h after meiosis induction from 500 to 1 bp upstream of transcription start sites defined elsewhere (45). (D) Box-and-Whisker plots showing H2A.Z levels at promoters at 4 h after meiosis induction (log2) for all annotated genes (All), downregulated genes in pht1Δ cells (Down) and upregulated genes in pht1Δ cells (Up). H2A.Z levels at promoters were calculated as in (C).

