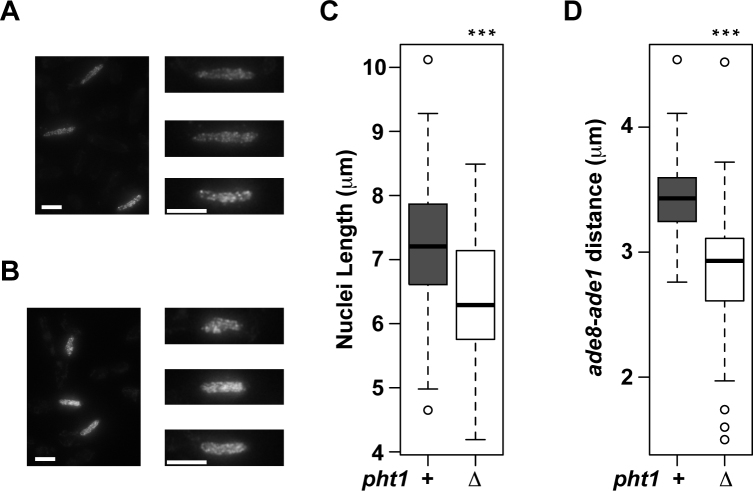
Figure 6.
Nucleus is more compact in pht1Δ cells than in pht1+ cells. (A–C) pht1+ and pht1Δ cells expressing Rec10-GFP were induced to enter meiosis by nitrogen withdrawal. Cells undergoing horsetail movement were selected and their nucleus lengths were measured. (A and B) (Left panels) A maximum-intensity projection image of pht1+ (A) and pht1Δ(B) cells. The scale bars are 5 μm. (Right panels) Nuclei shown in the left panels are magnified and aligned. The scale bars are 5 μm. Note that these images are maximum-intensity projections and do not reflect decreased Rec10-GFP signal intensity in pht1Δ cells (Supplementary Figure S9B), which was revealed by summing signal intensities of all focal panels. (C) A box plot summarizing the observation of 96 (pht1+) and 83 (pht1Δ) nuclei. (D) The distance between ade1 and ade8 loci in pht1+ and pht1Δ horsetail nuclei was measured as described before (46). A box plot summarizing the observation of 47 (pht1+) and 49 (pht1Δ) nuclei is shown.

