
Fig. 3.
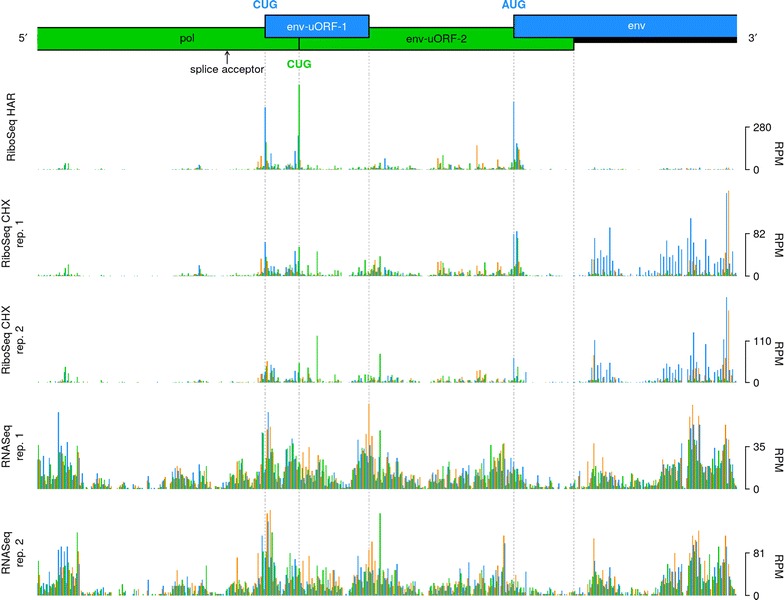
Coverage of the region surrounding the MuLV env gene splice acceptor. Bar plots show the number of 5′ read ends (with + 12 nt offset) mapped to viral RNA in RiboSeq HAR, RiboSeq CHX and RNASeq libraries generated from Rat2 cell infections, in reads per million (RPM). Blue, green and orange bars correspond to reads mapping in phases 0, + 1 and + 2, respectively, relative to the env ORF. Translation of env-uORF-1 and env-uORF-2 is initiated from CUG codons that coincide with large peaks in RiboSeq HAR data