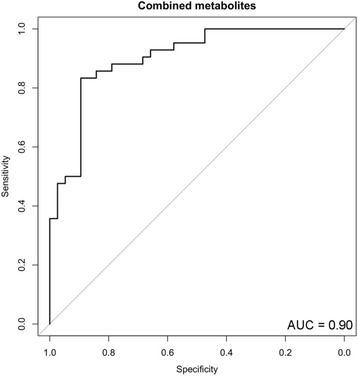
Fig. 2.

Receiver operator characteristic (ROC) curve analysis of statistically significant metabolites in the cerebrospinal fluid between Alzheimer’s disease (AD) and idiopathic normal pressure hydrocephalus (iNPH). ROC curve analysis was performed to compare the predictive power of AD and iNPH with the combined metabolites
