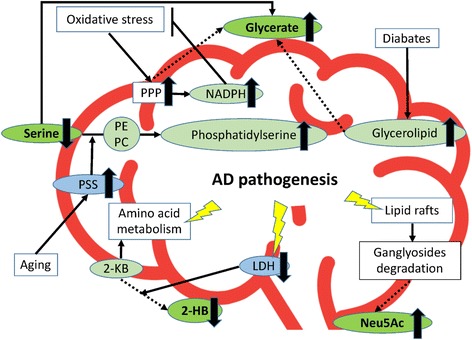
Fig. 6.

A model of the relationship of Alzheimer’s disease-specific metabolites indicated in this study. Serine, glycerate, Neu5Ac, and 2-HB are depicted with the AD-related metabolites, phenomenon, structures and metabolic pathways. Metabolites detected in this study are indicated in green oval with bold letters. Other related metabolites are indicated in light green oval. Enzymes are indicated in light blue oval. The phenomena, structure and pathways known to participate with AD pathogenesis are indicated in square. Valid allows indicate the interactions previously reported. Dotted allows indicate predicted interactions. Red bold line indicates the brain and CSF boundary. 2-KB: 2-ketobutyrate; 2-HB: 2-hydroxybutyrate; AD: Alzheimer’s disease; LDH: lactate dehydrogenase; NADPH: nicotinamide adenine dinucleotide phosphate; Neu5Ac: N-acetylneuraminate; PC: phosphatidylcholine; PE: phosphatidylethanolamine; PPP: pentose phosphate pathway; PSS: phosphatidylserine synthase
