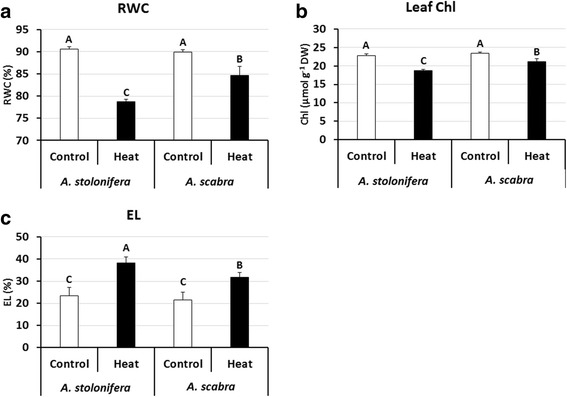
Fig. 1.

Leaf relative water content (RWC) (a), chlorophyll content (Chl) (b), and electrolyte leakage (EL) (c) of A. stolonifera and A. scabra under control and heat stress conditions. Data shown are the means of four biological replicates (n = 4). Bar represents standard error (SE) for each mean value. Different letters atop bars indicate that significant differences exist at P level < 0.05
