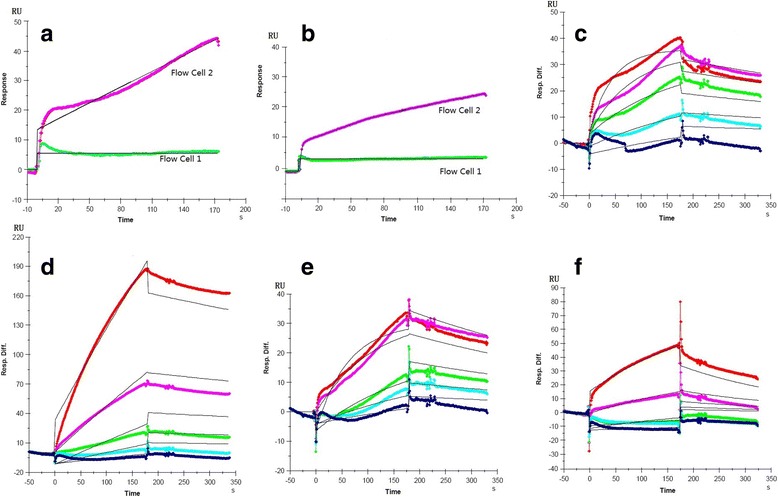
Fig. 6.

The chip fidelity and sensorgrams of interaction between the immobilized HA-H and purified analytes at different concentrations (12.5, 25, 50, 100 and 200 nM). a the sensorgram of HA-F (200 nM) injected into Flow cell 2 and blank runs at Flow cell 1. b the sensorgram of HA (200 nM) injected into Flow cell 2 and blank runs at Flow cell 1. c HA-F. d HA-HRA. e HA-HRB. f HA
