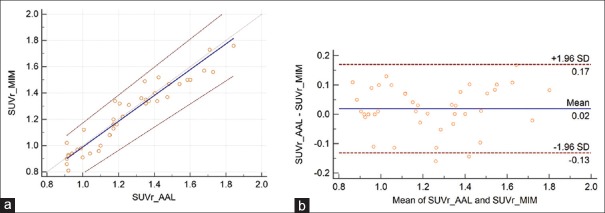
Figure 3.
(a) The Passing–Bablok regression scatter diagram with the regression line (solid line), the confidence interval for regression line (dashed lines), and identity line (x = y, dotted line) for standardized uptake value ratio values was obtained from both methods and from all the 42 cases. Standardized uptake value ratio AAL denotes the values obtained using PMOD Neuro approach and anatomical automatic labeling atlas and standardized uptake value ratio MIM values obtained using MIM approach (n = 42, ρ = 0.96). (b) Bland–Altman plot for all 42 cases, with a mean difference of 0.02 ± 0.15. The repeatability coefficient was 0.15 (12.3% of the mean)

