
Fig. 2.
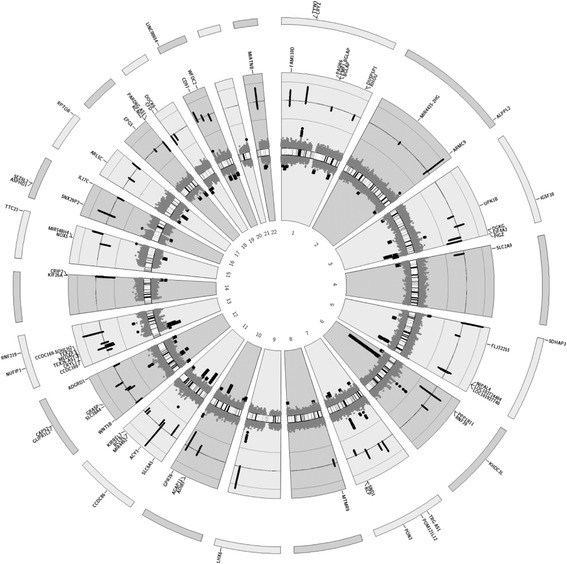
Circos plot of genome-wide DNA methylation changes between migraine cases and non-migraine controls. The inner circle displays an ideogram ordered by chromosome number; black dots represent combined P values using Fisher’s method for each 1-kb sliding region (dots pointing outwards represent hypermethylated windows while the dots pointing inwards represent hypothmetylated regions); green and red dots represent significant (FDR < 0.05) hypermethylated and hypomethylated regions, respecitvely. The middle circle shows the baseline beta-value difference between migraine cases and non-migraine controls for genome-wide signficant regions; the green lines represent hypermethylated regions and red lines hypomethylated regions, and the length of each line represents the beta-value difference. The outermost circles display the RefSeq genes associated with hypomethylated (red) and hypermethylated regions (green)