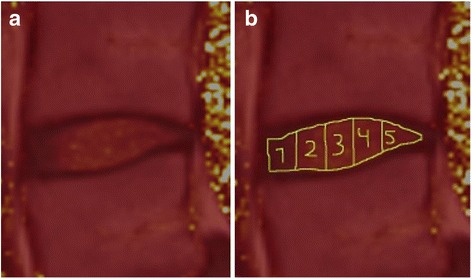
Fig. 1.

Typical color setting of the images used for the IVD segmentation (a). The images, used for IVD segmentation, were derived by fusing T1-weighted images with T2-map images to enhance the borders of the IVDs. The IVDs were divided in to five subregions (ROI1–5), each with different volume but the same sagittal measure (b)
