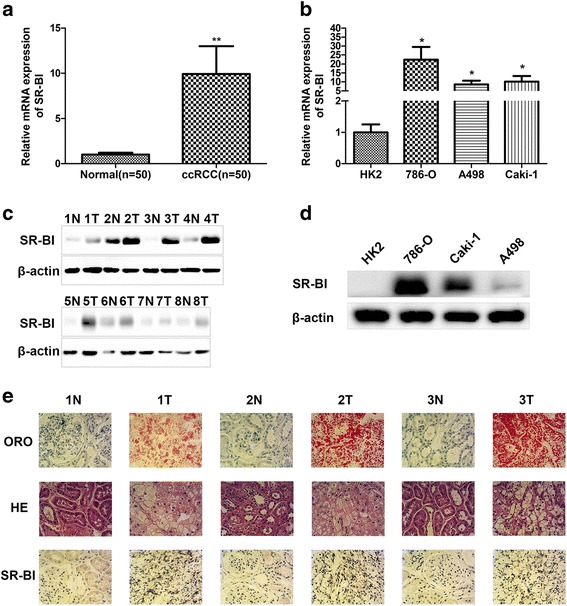
Fig. 1.

Overexpression of SR-BI in ccRCC. Relative mRNA expression of SR-BI in normal kidney and ccRCC tissues (a), normal kidney cell line and ccRCC cell lines (b) by qRT-PCR. Protein expression of SR-BI in normal kidney and ccRCC tissues (c), normal kidney cell line and ccRCC cell lines (d) by western blot. Representative images of ORO staining, HE staining and IHC analysis of SR-BI protein in normal kidney and ccRCC tissues (e) (original magnification ×400). *P < 0.05, **P < 0.01
