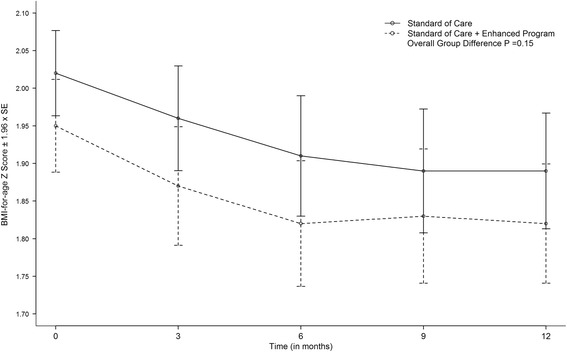
Fig. 2.

Change in body mass index Z-score by randomization group. Change in body mass index (BMI) Z-score by randomization group from baseline to 12-months (n = 182 in Standard Care Alone (control) intervention; n = 178 in Standard Care + Enhanced Program (experimental) intervention. The rate of change in the mean BMI Z-score decreased 0.12 (SE: 0.03) units in the control intervention vs. 0.15 (SE: 0.03) in the experimental intervention (<0.01) per 12-months for both interventions with no significant difference observed between the groups (P = 0.15)
