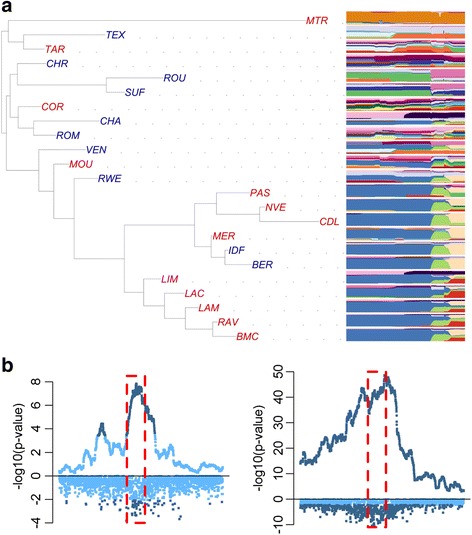
Fig. 6.

Selection signature around genes ABCG2, NCAPG and LCORL on chromosome 6. a Population tree (left) constructed in the region under selection with haplotype cluster plots shown for each breed (right). hapFLK and FLK p-values for the selection signature in the northern (b) and southern (c) populations
