
Figure 1.
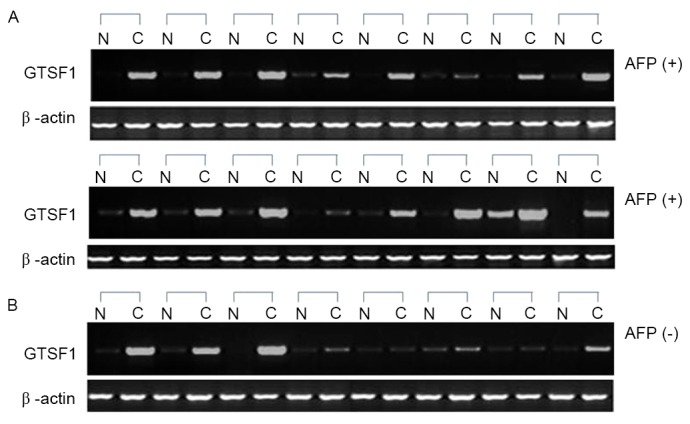
Expression levels of GTSF1 mRNA in 24 paired liver cancer and adjacent non-tumor tissues, evaluated via reverse transcription quantitative polymerase chain reaction. (A) Analysis of GTSF1 mRNA expression levels in HCC tissue samples from 16 AFP-positive patients. (B) Analysis of GTSF1 mRNA expression levels from 8 patients with AFP-negative liver cancer tissues. β-actin served as the internal control. N, adjacent noncancerous liver; C, HCC tissue; AFP, α-fetoprotein; GTSF1, gametocyte-specific factor 1 gene.