Figure 3.

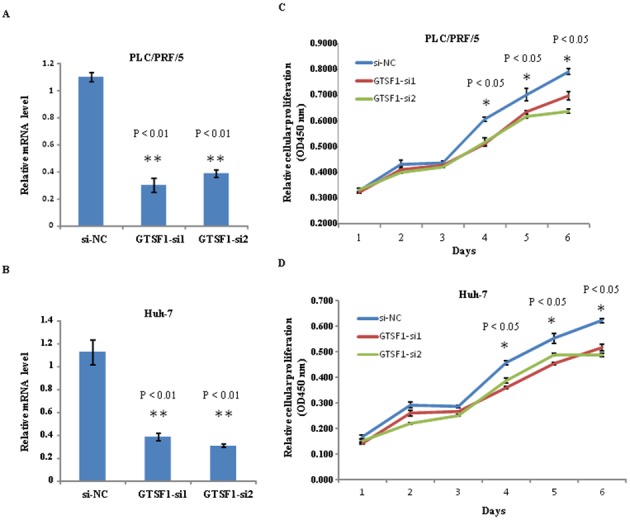
Analysis of GTSF1 mRNA expression levels in human liver cancer cell lines following transfection with two siRNA molecules targeting GTSF1. (A) Silencing of relative GTSF1 mRNA expression in PLC/PRF/5 cell lines using siRNA1 and siRNA2. Error bars denote the standard deviation, and calculated **P<0.01 compared with siNC. (B) Silencing of relative GTSF1 mRNA expression in Huh-7 cell lines using siRNA1 and siRNA2. (C) The relative cellular proliferation level of GTSF1-siNC-, GTSF1-siRNA1- and GTSF1-siRNA2-transfected PLC/PRF/5 cells from days 1–6. The level of relative proliferation was measured at 450 nm absorbance after 1 h of incubation. The relative proliferation of PLC/PRF/5 cells was significantly decreased from days 3–6, when compared with the GTSF1-siNC and siRNA groups. Cell growth assays were performed in 96-well microtiter plates and all assays were performed in triplicate. GTSF1 expression without siRNA interference (GTSF1-siNC) was used as the positive control. (D) The relative cellular proliferation level of Huh-7 cells following GTSF1-siNC, GTSF1-siRNA1 and GTSF1-siRNA2 interference. **P<0.01 (relative GTSF1 mRNA expression in GTSF1-siNC groups compared with GTSF1-siRNA1 groups and in GTSF1-siNC groups compared with GTSF1-siRNA2 groups). *P<0.05 (relative proliferation in GTSF1-siRNA1 and GTSF1-siRNA2 groups compared with the GTSF1-siNC group). NC, negative control; GTSF1, gametocyte specific factor 1; si, small interfering.
