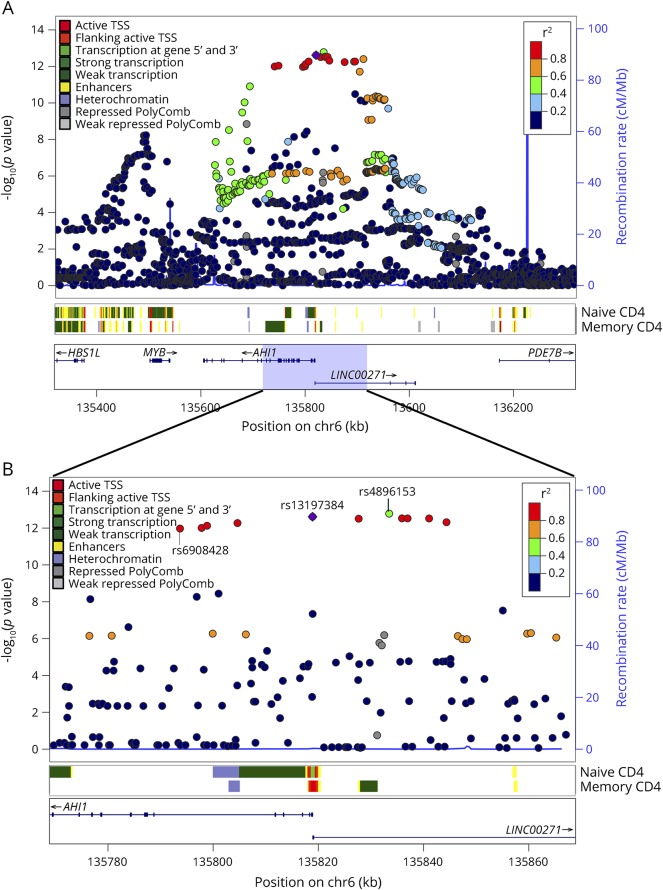
Figure 1. SNAP plot of the chromatin state overlapping the SNPs in LD with the AHI1 cis-eQTL and MS susceptibility variant, rs4896153 in CD4+ T cells.
(A) Naive (CD4+CD25−CDRA+) and memory (CD4+CD25−CDRA−) CD4+ T cell–specific chromatin state mapping was generated using the chromHMM algorithm in 1-Mb and 100-kb views surrounding the AHI1 locus. ChIP-seq data generated by the ENCODE/ROADMAP project reveal various chromatin marks including enhancers, heterochromatin, and polycomb, and various transcription marks are color coded. All the discovered SNPs from dbGAP137 are listed including their p value of association to MS, the recombination rate. The LD structure is represented in the r-square value calculated from the Broad SNAP server and is assigned in red. The strongest MS-associated variant rs4896153 (green) and the strongest eQTL variant rs6908428 are labeled. (B) Zoom in of the region overlapping the rs13197384 showing the chromatin state in naive and memory T cells. eQTL = expression quantitative trait locus; LD = linkage disequilibrium; TSS = transcription start site.

