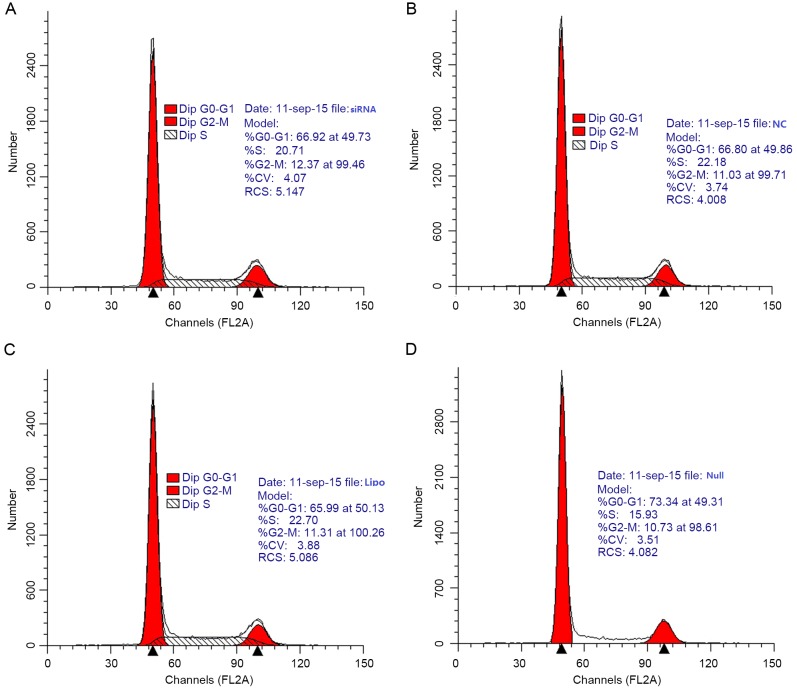
Figure 6.
Cell cycle distribution analysis by flow cytometry. (A) siRNA group; (B) NC group; (C) Lipo group and (D) Null group 24 h after transfection of SW620 cells. Differences in the G0/G1, S and G2/M phase distribution were not statistically significant between the siRNA group and NC group (ns vs. NC). siRNA, small interfering target RNA; Null, control group; NC, nonspecific siRNA; Lipo, Lipofectamine-only group; ns, not significant.

