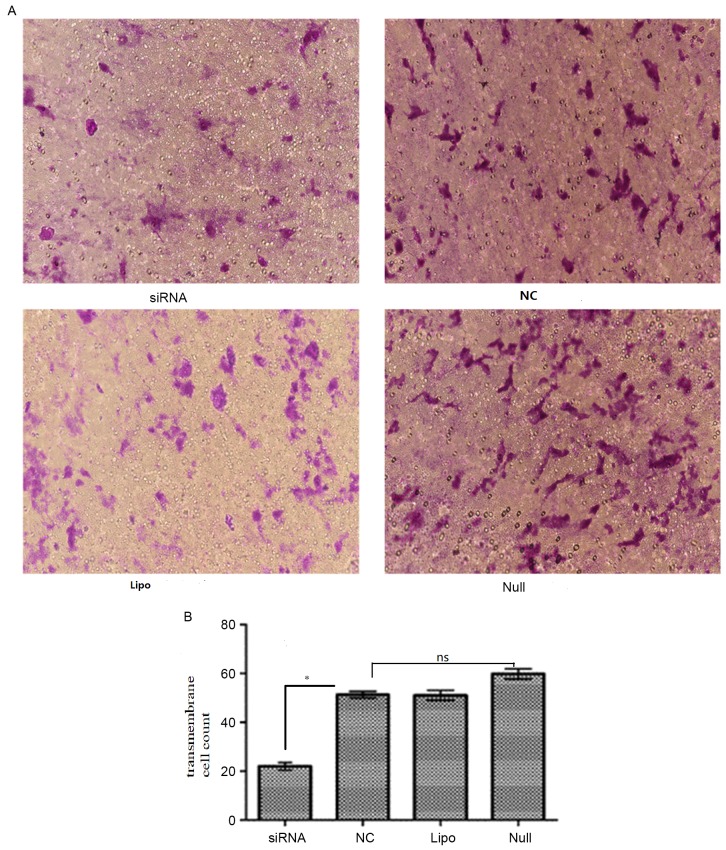
Figure 8.
Transwell assay analysis of cell migration. (A) Representative images (magnification, ×400) and (B) quantification of the Transwell cell migration assay. Comparing the transmembrane cell count in siRNA, NC, Lipo and Null groups of SW620 cells after transfected 48 h. The number of migrated cells in siRNA group were significantly decreased compared with that observed in the NC group (*P<0.05 vs. NC), while the differences were not statistically significant among Null group, Lipo group and NC group (ns vs. Null/Lipo). *P<0.05. NC, negative control; Lipo, Lipofectamine-only group; siRNA, short interfering RNA group; ns, not significant.

